
Plan graph
ReadyNodes, costs, and row estimates laid out as a graph that fits the panel.

Fetching…
Read execution plans as a graph instead of indented text, with costs and suggestions beside the query.
Running EXPLAIN opens the plan as a node graph under the editor, fitted to the panel. Each node shows its operation and cost, the most expensive paths are highlighted, and a suggestions tab points out issues such as sequential scans on large tables. Partition pruning is visible at a glance: only the partitions the planner kept appear in the graph.
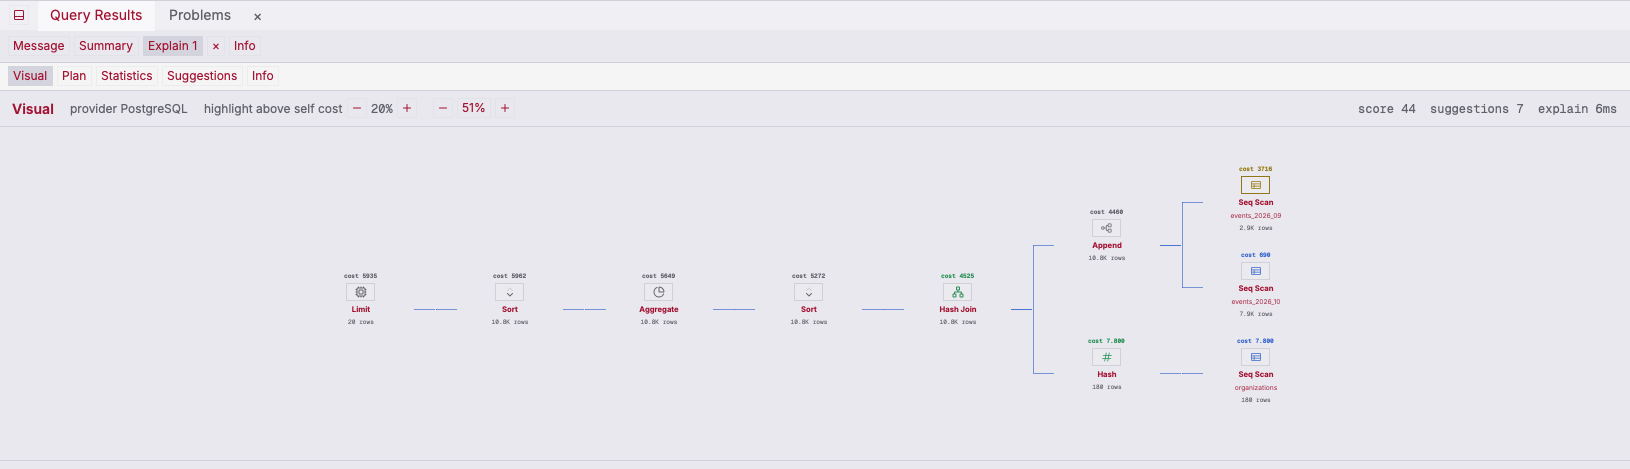
Run EXPLAIN on the statement in the editor.
Follow the most expensive path and check which partitions were scanned.
Use the suggestions tab to decide on an index or a rewrite.
Nodes, costs, and row estimates laid out as a graph that fits the panel.
Hints about scans, joins, and estimates worth a closer look.
The plan text and statistics stay one tab away.
Live database activity and server statistics in the workspace.